The Reports > Sales screens provide a variety of reports that allow administrators to dig into how the company is performing, broken down by different variables of interest. There are currently up to eight available sales reports, depending on your organization's settings.
Sales Overview
Basics
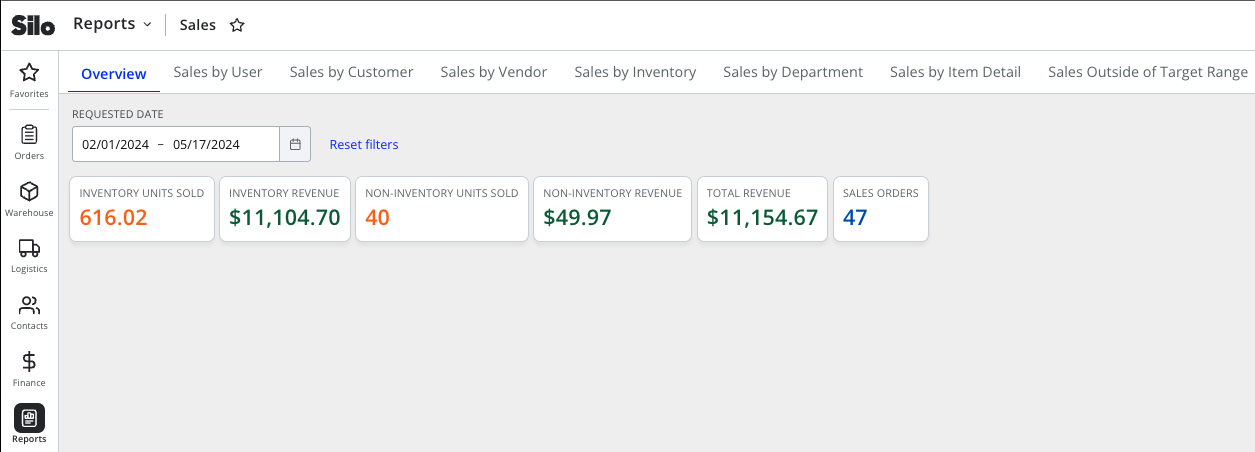
- High-level summary boxes with information about sales during the selected date range, including total inventory revenue, total inventory units sold, total non-inventory revenue, total non-inventory units sold, and the total number of sales orders.
Relevant Settings & Permissions
- Access to this report is controlled by the Report features > Sales Reports >
Sales Overviewpermission.
Calculations
- Inventory Units Sold = number of inventory units on SOs in the specified time range, minus any restock credits associated with them (regardless of the credit date)
- Inventory Revenue = total price of all inventory units on SOs in the specified time range, minus any credit amounts associated with them (regardless of the credit date)
- Non-Inventory Units Sold = number of non-inventory units on SOs in the specified time range, minus any credits associated with them (regardless of the credit date)
- Non-Inventory Revenue = total price of all non-inventory units on SOs in the specified time range, minus any credit amounts associated with them (regardless of the credit date)
- Total Revenue = Inventory Revenue + Non-Inventory Revenue
- Sales Orders = total number of non-credit SOs in the specified time range + the number of credit SOs associated with them, regardless of the credit date
Sales by User
Basics
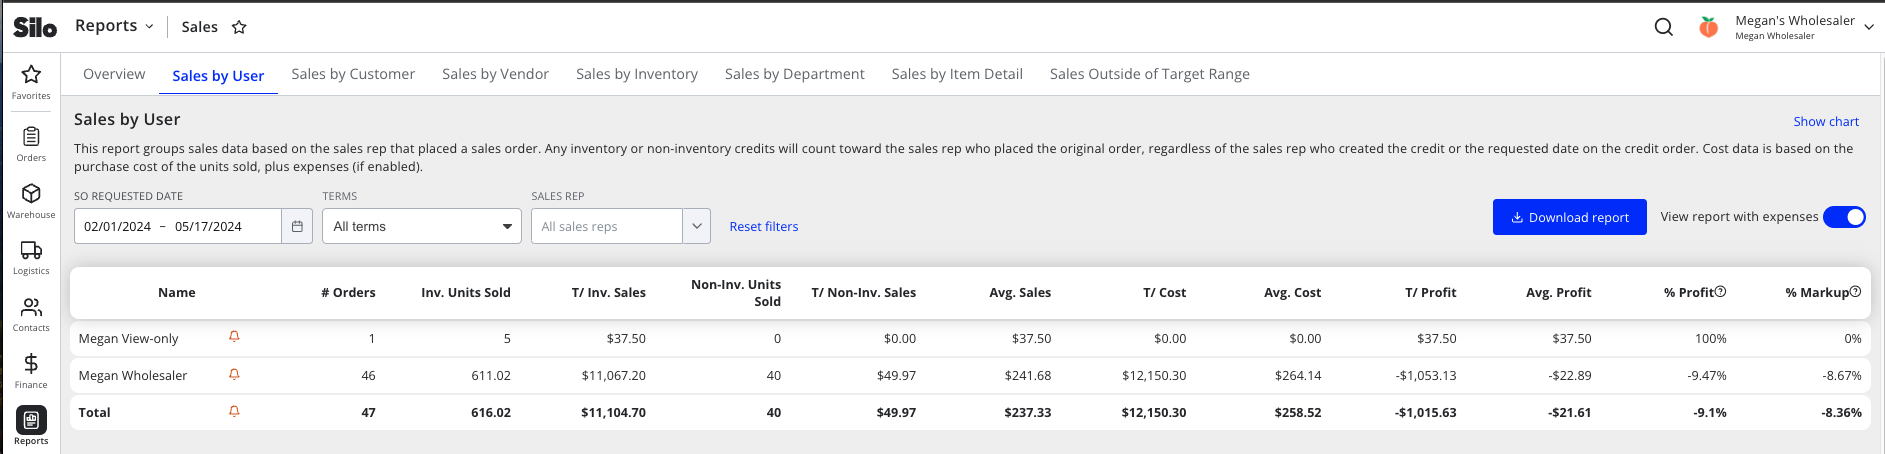
- Provides sales & profit totals for individual salespeople based on the sales rep recorded on each sales order. This gives business owners greater insight into who brings money to the business across any given date range.
- Shows a row for each user listed as the rep on a sales order in the specified date range and a 'Total' row. Note that credit orders will always count towards the original order’s values, regardless of whether the credit occurred in the specified date range or had a different salesperson.
- Each row shows the name of the salesperson (or 'Uncategorized' for orders without a salesperson, like Storefront orders), an oversold indicator (sales not assigned to a lot make profit calculations less accurate because there is no associated item cost), the number of orders they placed, total inventory/non-inventory units sold, total inventory/non-inventory sales $, average sales $ per order, the total cost of items sold, the average cost per order, total profit, average profit per order, profit as a percent of total sales, and markup percent.
- Allows filtering the sales orders included in these values based on customer terms (cash or Net D >0) and filtering down to a specific sales rep
- Includes a toggle for whether expenses should be included in calculations or not
- Includes a 'Show chart' toggle that shows/hides a graph of T/ Sales and T/ Profit overall and for each user
- Includes an option to download the report data to a CSV
Relevant Settings & Permissions
- The Report features > Sales Reports > Sales by User (All Users) >
Only minepermission gives users access to this report with the Sales Rep filter locked to the current logged in user, so that they are only able to see information about their own sales. -
Sales by User (All Users)permission gives full access to all data on the report.
Calculations
- T/ Sales = sum of sale price for all SOs made (including cost adjustments) - any credits associated with these SOs (even if the credits aren’t in the specified date range)
- Avg. Sales = T/ Sales ➗ # Orders
- T/ Cost = sum of purchase price for all items sold [+ sum of purchase/lot expenses for all items sold if ‘View expenses' is toggled on]
- Avg. Cost = T/ Cost ➗ # Orders
- T/ Profit = T/ Sales - T/ Cost [- Total SO Expenses if ‘View expenses’ is toggled on]
- Avg. Profit = T/ Profit ➗ # Orders
- Profit % = T/ Profit ➗ T/ Sales
- Markup % = T/ Profit ➗ T/ Cost
Sales by Customer
Basics
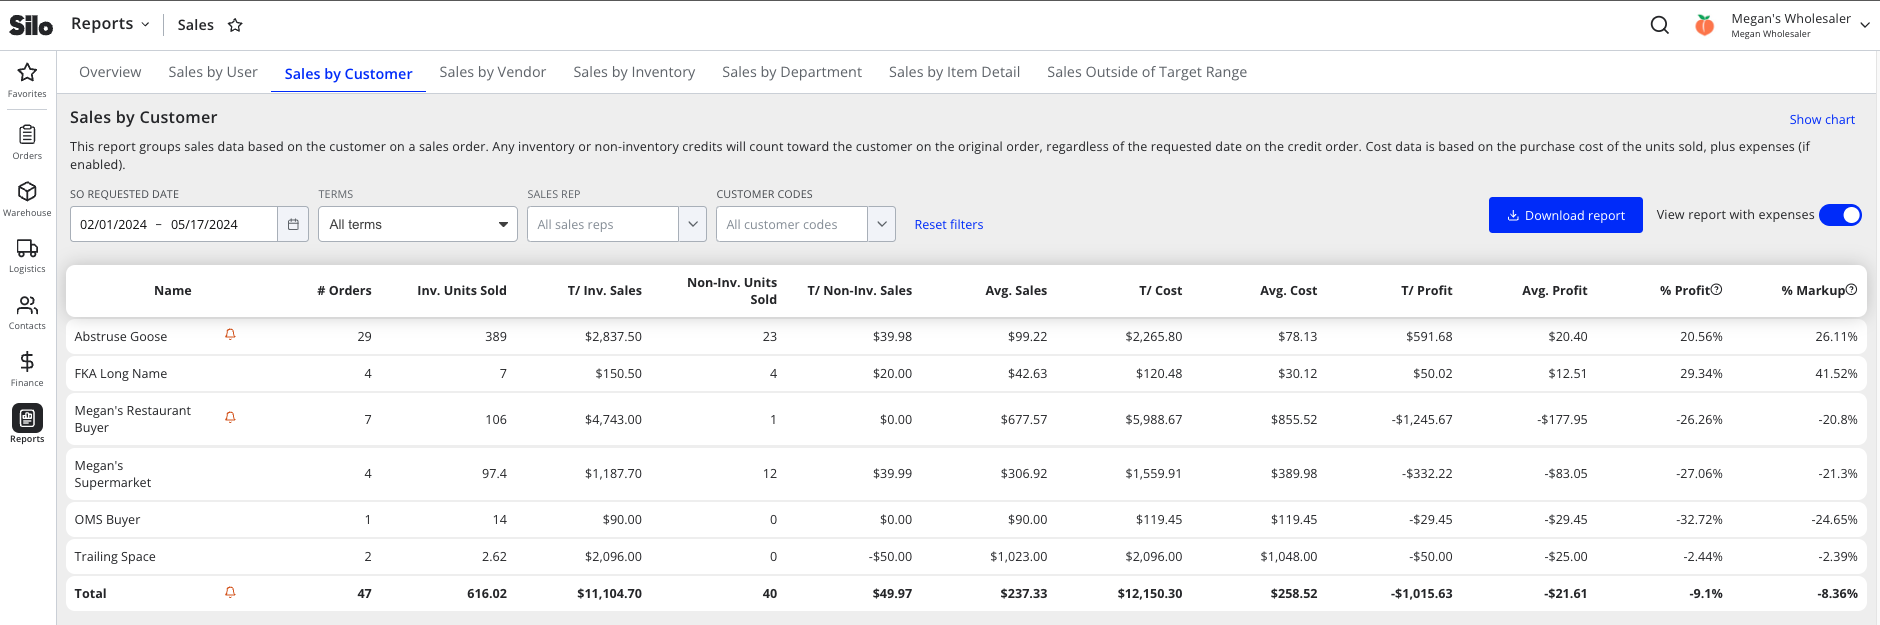
- Highlights revenues & profitability across any given date range on a per-customer basis. Business owners can use these insights to make sales & outreach decisions.
- Shows a row for each customer with sales orders in the specified date range and a 'Total' row. Note that credit orders will always count towards the original order’s values, regardless of whether the credit occurred in the specified date range.
- Each row shows the customer name, an oversold indicator (sales not assigned to a lot will make profit calculations less accurate because there is no associated item cost), the number of sales orders, total inventory/non-inventory units sold, total inventory/non-inventory sales $, average sales $ per order, the total cost of items sold, the average cost per order, total profit, average profit per order, profit as a percent of total sales, and markup percent.
- Allows filtering the sales orders included in these values based on customer terms (cash or Net D >0), filtering down to a specific sales rep, and filtering by customer code
- Includes a toggle for whether expenses should be included in calculations or not
- Includes a 'Show chart' toggle that shows/hides a graph of T/ Sales and T/ Profit overall and for each customer
- Includes an option to download the report data to a CSV
Relevant Settings & Permissions
- The Report features > Sales Reports > Sales by Customer (All Users) >
Only minepermission gives users access to this report with the Sales Rep filter locked to the current logged in user, so that they are only able to see information about their own sales. - Report features > Sales Reports > Sales by Customer (All Users) >
Sales totalspermission gives users access to this report with the Sales Rep filter locked to "All users", so that they are able to see company-wide sales totals but not dig into metrics for any specific sales rep. -
Sales by Customer (All Users)permission gives full access to all data on the report.
Calculations
- T/ Sales = sum of sale price for all SOs made (including cost adjustments) - any credits associated with these SOs (even if the credits aren’t in the specified date range)
- Avg. Sales = T/ Sales ➗ # Orders
- T/ Cost = sum of purchase price for all items sold [+ sum of purchase/lot expenses for all items sold if ‘View expenses' is toggled on]
- Avg. Cost = T/ Cost ➗ # Orders
- T/ Profit = T/ Sales - T/ Cost [- Total SO Expenses if ‘View expenses’ is toggled on]
- Avg. Profit = T/ Profit ➗ # Orders
- Profit % = T/ Profit ➗ T/ Sales
- Markup % = T/ Profit ➗ T/ Cost
Sales by Vendor
Basics
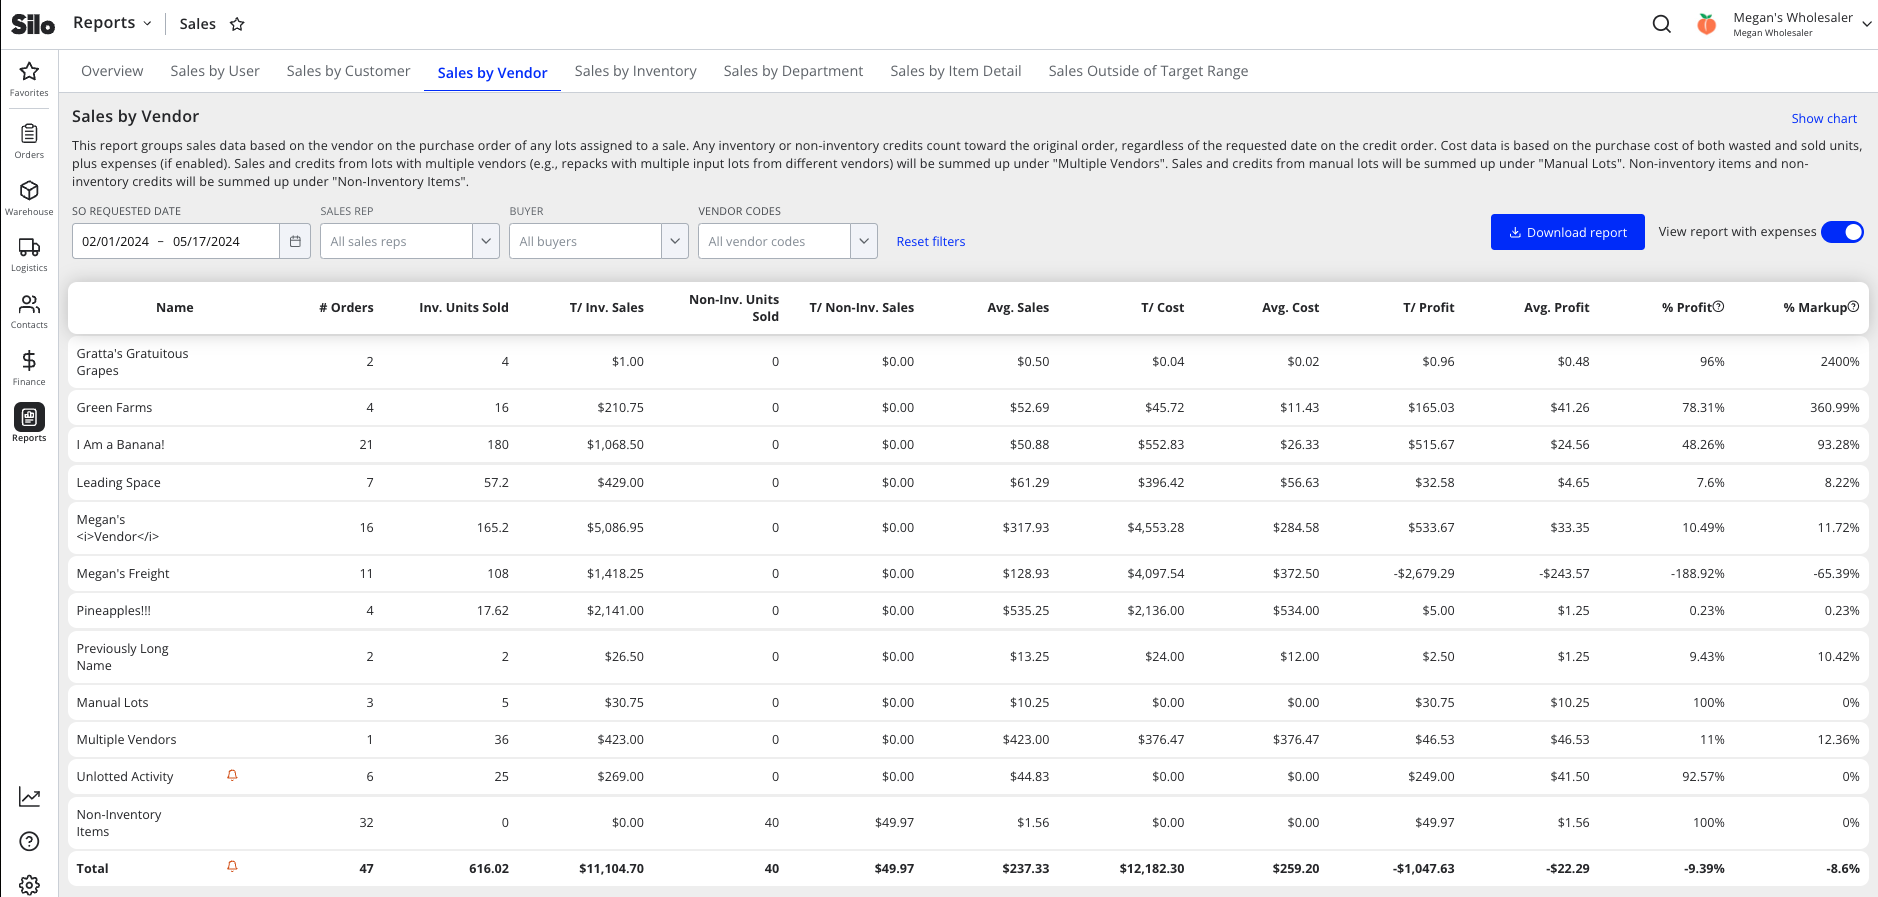
- Highlights revenues & profitability of products purchased from each vendor across any given date range (as well as lines for ‘Unlotted Activity’, ‘Non-Inventory Items’, and ‘Manual Lots’, which don’t have associated vendors, and ‘Multiple Vendors’ for sales from repack or transfer lots with multiple input vendors). Business owners can use these insights to make purchasing decisions based on the vendors they earn the most profit from.
- Shows a row for each vendor with sales orders out of their lots in the specified date range and a 'Total' row. Note that credit orders will always count towards the original order’s values, regardless of whether the credit occurred in the specified date range. Also, note that any waste out during the specified time range will be reflected here (counted as $0 of sales with the wasted units contributing to the total cost).
- Each row shows the vendor name, the number of sales orders out of their lots, total inventory/non-inventory units sold, total inventory/non-inventory sales $, average sales $ per order, the total cost of items sold, the average cost per order, total profit, average profit per order, profit as a percent of total sales, and markup percent. Note that because we are looking at lots for a particular vendor, wasted units from these lots will also be reflected in the T/ Cost value.
- Allows filtering to a specific sales rep (who made the sale), a specific buyer (who purchased the sold units from the vendor), or one or more specific vendor codes.
- Includes a toggle for whether expenses should be included in calculations or not
- Includes a 'Show chart' toggle that shows/hides a graph of T/ Sales and T/ Profit overall and for each customer
- Includes an option to download the report data to a CSV
Relevant Settings & Permissions
- The Report features > Sales Reports > Sales by Vendor (All Users) >
Only minepermission gives users access to this report with the Sales Rep filter locked to the current logged in user, so that they are only able to see information about their own sales. - Report features > Sales Reports > Sales by Vendor (All Users) >
Sales totalspermission gives users access to this report with the Sales Rep filter locked to "All users", so that they are able to see company-wide sales totals but not dig into metrics for any specific sales rep. -
Sales by Vendor (All Users)permission gives full access to all data on the report.
Calculations
- T/ Sales = sum of sale price for all SOs made (including cost adjustments) - any credits associated with these SOs (even if the credits aren’t in the specified date range)
- Avg. Sales = T/ Sales ➗ # Orders
- T/ Cost = sum of purchase price for all items sold + the sum of purchase price for all items wasted [+ sum of purchase/lot expenses for all items sold if ‘View expenses' is toggled on]
- Avg. Cost = T/ Cost ➗ # Orders
- T/ Profit = T/ Sales - T/ Cost [- Total SO Expenses if ‘View expenses’ is toggled on]
- Avg. Profit = T/ Profit ➗ # Orders
- Profit % = T/ Profit ➗ T/ Sales
- Markup % = T/ Profit ➗ T/ Cost
Sales by Inventory
Basics
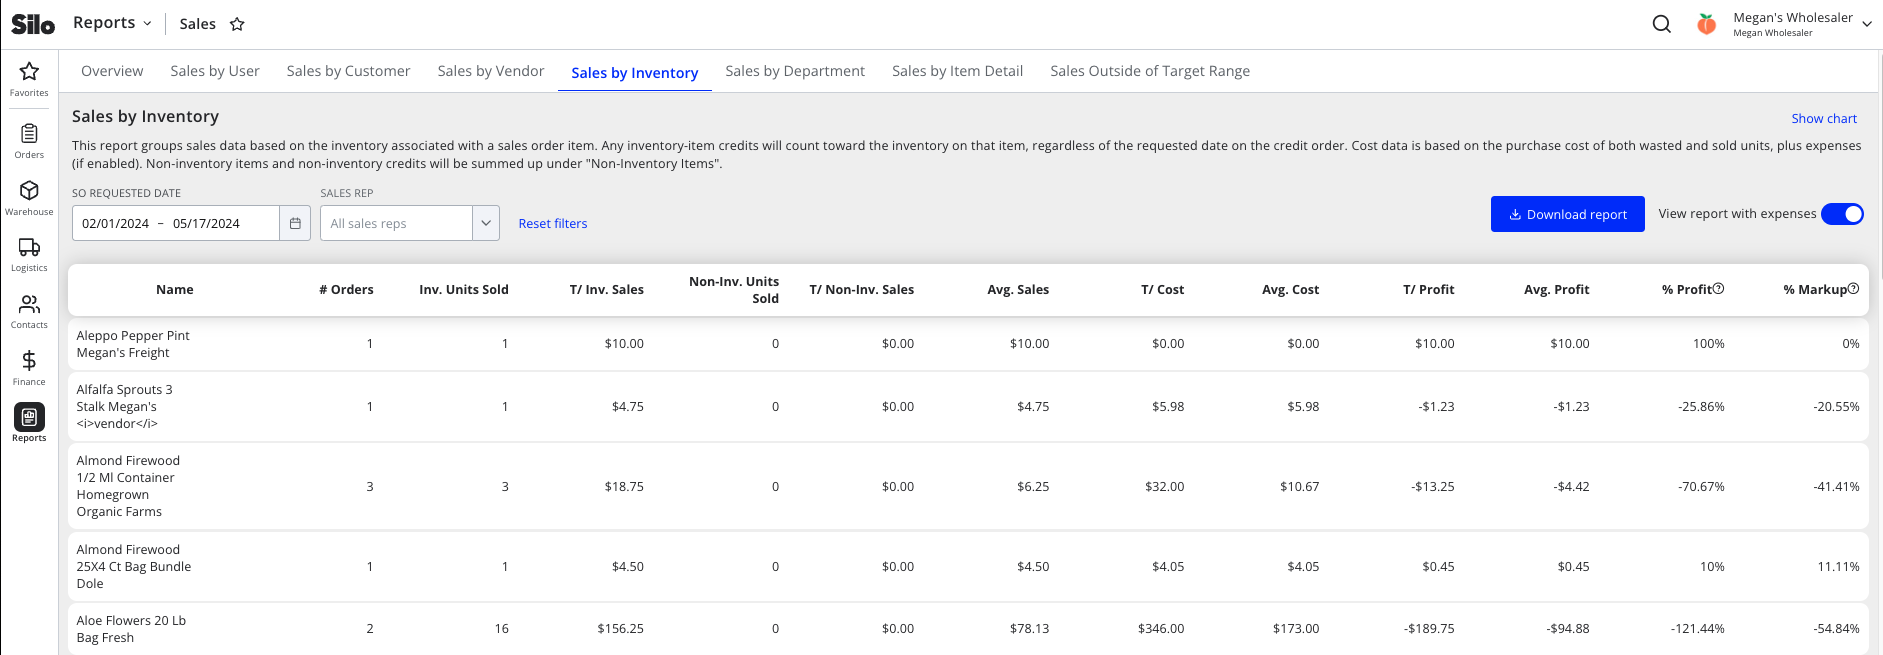
- This report can help business owners and salespeople drill into the performance of specific inventory items to help learn which products are trending, how newly carried items are performing, and which items are underperforming and require upselling or retirement.
- Shows a row for each inventory item sold in the specified date range, as well as a ‘Non-inventory items’ row and a 'Total' row. Note that item credits will always count towards the original item’s values, regardless of whether the credit occurred in the specified date range.
- Each row shows the item name, an oversold indicator (sales not assigned to a lot make profit calculations less accurate because there is no associated item cost), the number of orders for that item, total inventory/non-inventory units sold, total inventory/non-inventory sales $, average sales $ per order, the total cost of items sold, the average cost per order, total profit, average profit per order, profit as a percent of total sales, and markup percent. Note that because we are looking at inventory items, wasted units of these items will also be reflected in the T/ Cost value.
- Allows filtering down to sales made by a specific sales rep
- Includes a toggle for whether expenses should be included in calculations or not
- This includes all expenses associated with the sold item, regardless if it’s payable or not
- Includes a 'Show chart' toggle that shows/hides a graph of T/ Sales and T/ Profit overall and for each item
- Includes an option to download the report data to a CSV
Relevant Settings & Permissions
- The Report features > Sales Reports > Sales by Inventory (All Users) >
Only minepermission gives users access to this report with the Sales Rep filter locked to the current logged in user, so that they are only able to see information about their own sales. - Report features > Sales Reports > Sales by Inventory (All Users) >
Sales totalspermission gives users access to this report with the Sales Rep filter locked to "All users", so that they are able to see company-wide sales totals but not dig into metrics for any specific sales rep. -
Sales by Inventory (All Users)permission gives full access to all data on the report.
Calculations
- T/ Sales = sum of sale price for all SOs made (including cost adjustments) - any credits associated with these SOs (even if the credits aren’t in the specified date range)
- Avg. Sales = T/ Sales ➗ # Orders
- T/ Cost = sum of purchase price for all items sold + the sum of purchase price for all items wasted [+ sum of purchase/lot expenses for all items sold if ‘View expenses' is toggled on]
- Avg. Cost = T/ Cost ➗ # Orders
- T/ Profit = T/ Sales - T/ Cost [- Total SO Expenses if ‘View expenses’ is toggled on]
- Avg. Profit = T/ Profit ➗ # Orders
- Profit % = T/ Profit ➗ T/ Sales
- Markup % = T/ Profit ➗ T/ Cost
Sales by Department
Basics
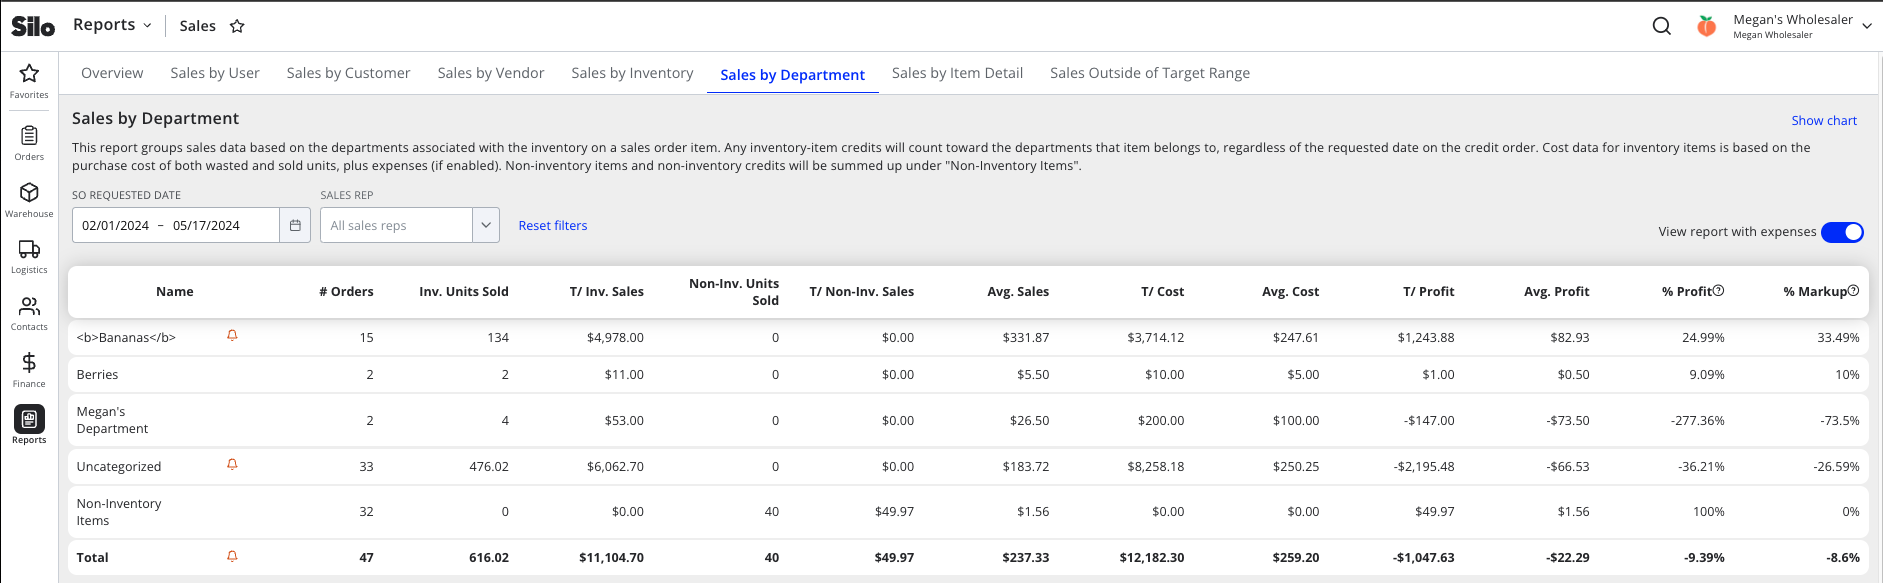
- Provides insight into how well different factions of the business are functioning and how well they are performing comparatively.
- Shows a row for each department containing items that have been sold in the specified date range, an 'Uncategorized' row for items sold that don't belong to a department, a ‘Non-Inventory Items’ row (since these can’t be associated with a department), and a 'Total' row. Note that item credits will always count towards the original item’s values, regardless of whether the credit occurred in the specified date range.
- Each row shows the department name, an oversold indicator (sales not assigned to a lot will make profit calculations less accurate because there is no associated item cost), the number of orders containing items in that department, total inventory/non-inventory units sold, total inventory/non-inventory sales $, average sales $ per order, the total cost of items sold, the average cost per order, total profit, average profit per order, profit as a percent of total sales, and markup percent. Note that because we are looking at inventory items within a department, wasted units of these items will also be reflected in the T/ Cost value.
- Allows filtering down to sales made by a specific sales rep
- Includes a toggle for whether expenses should be included in calculations or not
- Includes a 'Show chart' toggle that shows/hides a graph of T/ Sales and T/ Profit overall and for each department
Relevant Settings & Permissions
- The Report features > Sales Reports > Sales by Department (All Users) >
Only minepermission gives users access to this report with the Sales Rep filter locked to the current logged in user, so that they are only able to see information about their own sales. - Report features > Sales Reports > Sales by Department (All Users) >
Sales totalspermission gives users access to this report with the Sales Rep filter locked to "All users", so that they are able to see company-wide sales totals but not dig into metrics for any specific sales rep. -
Sales by Department (All Users)permission gives full access to all data on the report. - This report is only available if your organization has at least one department configured in Settings > Departments
Calculations
- T/ Sales = sum of sale price for all SOs made (including cost adjustments) - any credits associated with these SOs (even if the credits aren’t in the specified date range)
- Avg. Sales = T/ Sales ➗ # Orders
- T/ Cost = sum of purchase price for all items sold + the sum of purchase price for all items wasted [+ sum of purchase/lot expenses for all items sold if ‘View expenses' is toggled on]
- Avg. Cost = T/ Cost ➗ # Orders
- T/ Profit = T/ Sales - T/ Cost [- Total SO Expenses if ‘View expenses’ is toggled on]
- Avg. Profit = T/ Profit ➗ # Orders
- Profit % = T/ Profit ➗ T/ Sales
- Markup % = T/ Profit ➗ T/ Cost
Sales by Item Detail
Basics
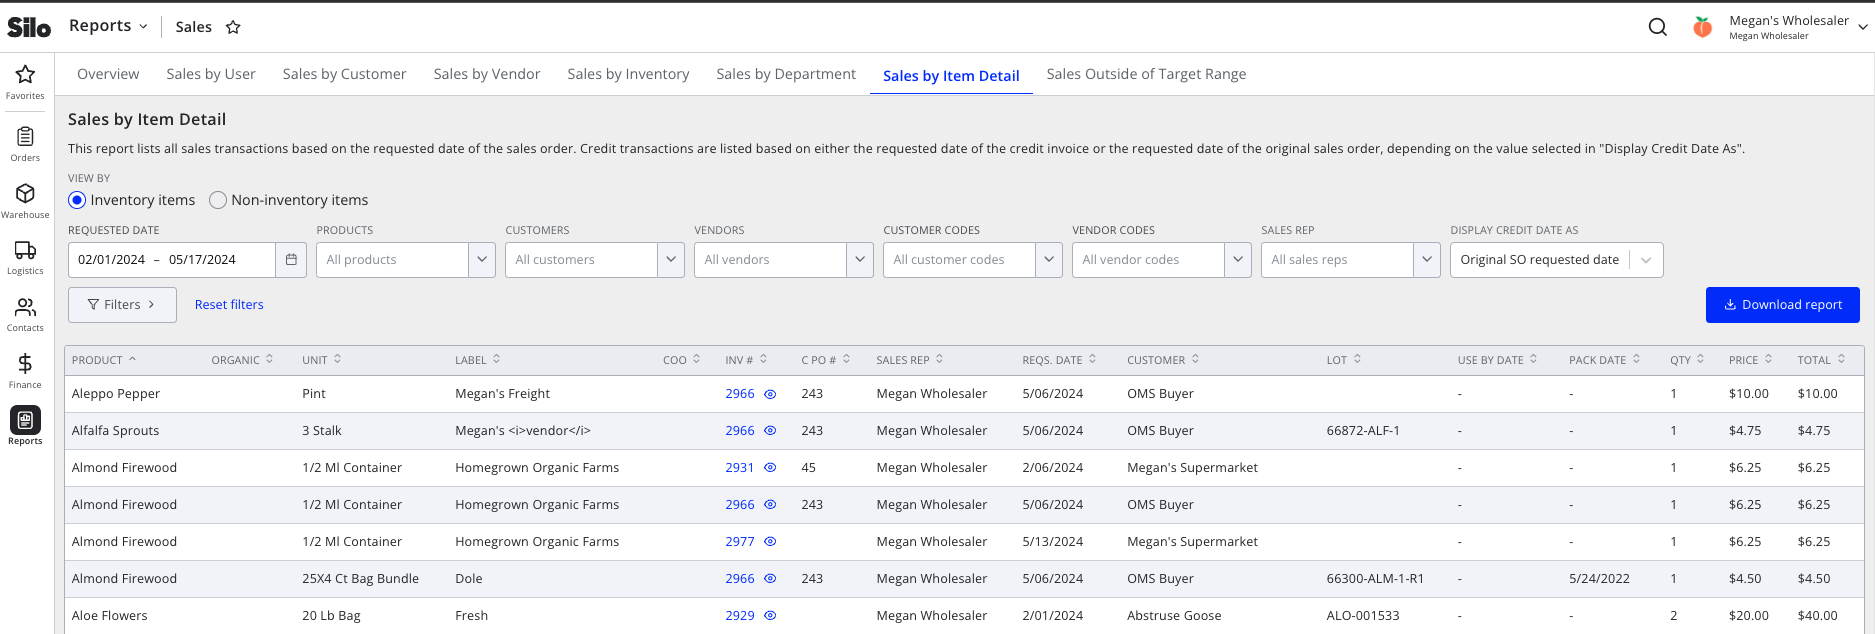
- Provides an extra layer of sales insight down to the item detail level. Using this tool, business owners and salesmen can study which items with which qualities performed best and better discern which qualities may contribute to particular outcomes.
- Shows a separate row for each sale item (i.e., each instance an item was sold) in the specified date range (including separate rows for credit items credited during the specified date range)
- Has one view for inventory item sales (default view)
- Each inventory row shows the product name, organic indicator, unit, label, country of origin, invoice number, customer PO number, sale location (if multiple locations are turned on), sales rep, SO requested date, customer, lot number, lot use by date, lot pack date, lot location (if multiple locations are turned on), quantity sold, price per unit, and total item price.
- The exported version is missing the customer PO number column. Still, it includes additional columns for invoice payment status, most recent invoice paid date, vendor, lot source, lot received date, cost per unit, total cost, total sold lot expenses, profit $, and profit %.
- Allows filtering the list by requested date range, product, customer, vendor, customer code, vendor code, sales rep, department, or sale location. There is also a credit date display filter that toggles whether credit items display the requested date of the credit SO (useful when reviewing what sales occurred during a given date range) or the requested date of the original SO that the credit was created from (useful when using the report export to report on week-over-week sales).
- Each inventory row shows the product name, organic indicator, unit, label, country of origin, invoice number, customer PO number, sale location (if multiple locations are turned on), sales rep, SO requested date, customer, lot number, lot use by date, lot pack date, lot location (if multiple locations are turned on), quantity sold, price per unit, and total item price.
- Please be careful when you compare this report with Sales by Vendor, Inventory, or Department, as those reports have waste information and this report does not.
- Has a separate view for non-inventory item sales (toggled using a radio button)
- Each non-inventory row shows the item name, category (and description, if populated), sales order ID, invoice number, customer PO number, sales rep, SO requested date, customer, quantity sold, price per unit, and the total item price
- Allows filtering the list by item name, category, customer, customer code, vendor code, sales rep, or sale location (if multiple locations are turned on).
- Each view includes a 'Download report' button to export the results to a CSV. The exports include the same column as the reports in the platform, with the following exceptions:
- The Inventory mode export does not include a column for customer PO numbers.
- The Inventory mode export includes extra columns to provide additional context about sales performance. These include SO #, invoice payment status, most recent invoice paid date, lot vendor, lot source, lot received date, item cost per unit, total item cost, total lot expenses for sold units, total profit, and profit as a percent of revenue.
Relevant Settings & Permissions
- The Report features > Sales Reports > Sales by Item Detail (All Users) >
Only minepermission gives users access to this report with the Sales Rep filter locked to the current logged in user, so that they are only able to see information about their own sales. - Report features > Sales Reports > Sales by Item Detail (All Users) >
Sales totalspermission gives users access to this report with the Sales Rep filter locked to "All users", so that they are able to see company-wide sales totals but not dig into metrics for any specific sales rep. -
Sales by Item Detail (All Users)permission gives full access to all data on the report. - Users with Seller features > Sales Orders >
View all sales orderspermission will see invoice/SO numbers displayed as hyperlinks that open the Sales Order detail window.
Sales Outside Target Range
Basics
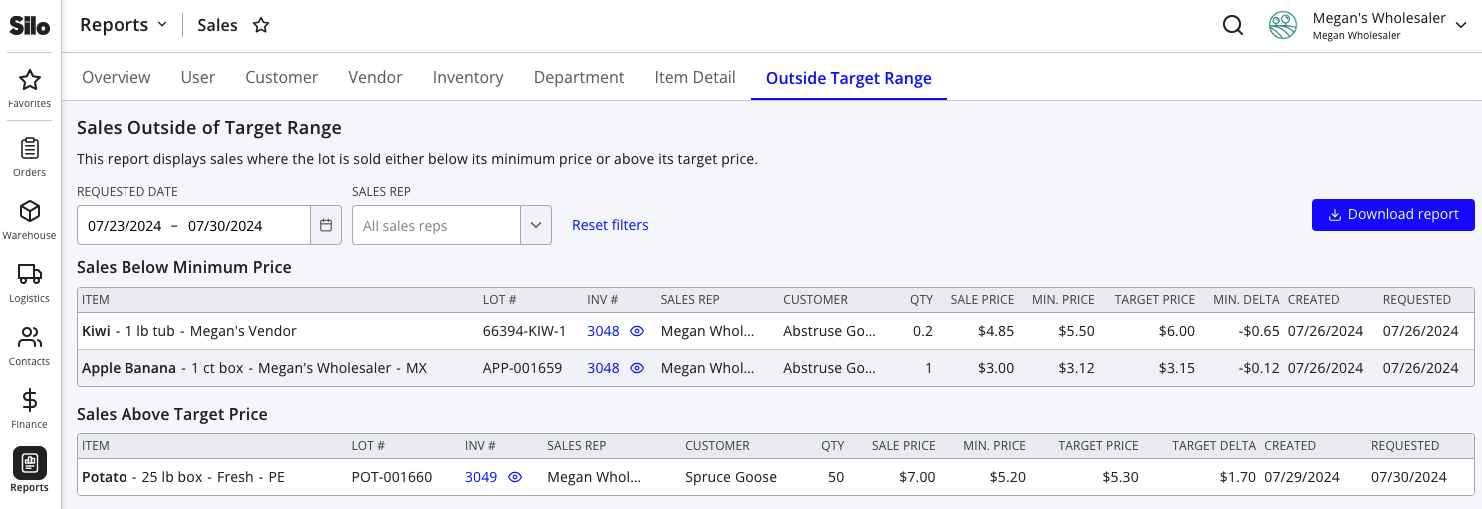
- Flags items that may have been sold for the wrong price (either below the ‘min. price’ or above the ‘target price’ specified for the lot) so the user can dig into the cause of pricing errors and opportunities for additional revenue.
- The report consists of two tables: Sales Below Minimum Price & Sales Above Target Price. Each shows a separate row for each sale item (i.e., each individual instance an item was sold) that meets the table criteria for the specified date range. The date range is based on the creation date of the sales order. Credits are not included.
- Each row shows the item information, lot #, invoice #, sales rep, customer, quantity, unit price, minimum price (in $), target price (in $), amount below minimum or above target (depending on the table), SO creation date, and SO requested date.
- Allows filtering the tables by requested date and sales rep.
- Includes a 'Download report' button to export the results to a CSV
- For further information, see: Reports: Sales Outside of Target Range
Relevant Settings & Permissions
- The Report features > Sales Reports > Sales Outside of Target Range (All Users) >
Only minepermission gives users access to this report with the Sales Rep filter locked to the current logged in user, so that they are only able to see information about their own sales. -
Sales Outside of Target Range (All Users)permission gives full access to all data on the report. - Users with Seller features > Sales Orders >
View all sales orderspermission will see invoice/SO numbers displayed as hyperlinks that open the Sales Order detail window. - Only accounts with the Allow specifying target price of lots on purchase orders setting turned on in Settings > Orders > Pricing Guidance will have access to this report.
FAQs
Why doesn’t total revenue on the sales reports match the totals shown in AR?
- Sales reporting focuses on how sales affect the performance of your inventory sliced by different variables (user, department, etc.). They include all sales in the specified date range, but they also include all credits associated with those sales regardless of date since it is impossible to get an accurate picture of sales performance without including any restocks, loss, or price adjustments made to the sale.
- Accounts Receivable, on the other hand, is focused on money moving in and out of your business. As a result, only transactions (sales, credits, payments) within the specified date range are included in reporting.
- Because of the difference in which credits are included between the sales reports and the AR screens, you'll likely see slightly different totals.
Why do the Sales by Vendor, Inventory, and Department reports show different total costs (and thus different total profits) than the Sales by User, Customer, and Item Detail reports?
- Sales by User, Sales by Customer, and Sales by Item Detail are all broken down based on sales order. As a result, they only reflect the cost of items sold.
- Sales by Vendor, Sales by Inventory, and Sales by Department are all broken down based on characteristics of the specific lots sold. As a result, they include the cost of any outgoing units from those lots, including both sold and wasted units.
- When wasted units are included, any items with waste are going to have a higher total cost, and thus the profit (calculated as sales minus cost) will be lower.
On Sales by Vendor, Inventory, and Department, why does the number of orders in the "Total" row not match the sum of the other rows?
- Sales can include multiple items bought from different vendors that belong to different departments, so one sale can be attributed to multiple vendors, inventory items, and departments on the report.