The Reports > Inventory screens provide a variety of reports that allow administrators to dig into how the company's inventory. There are currently seven available inventory reports.
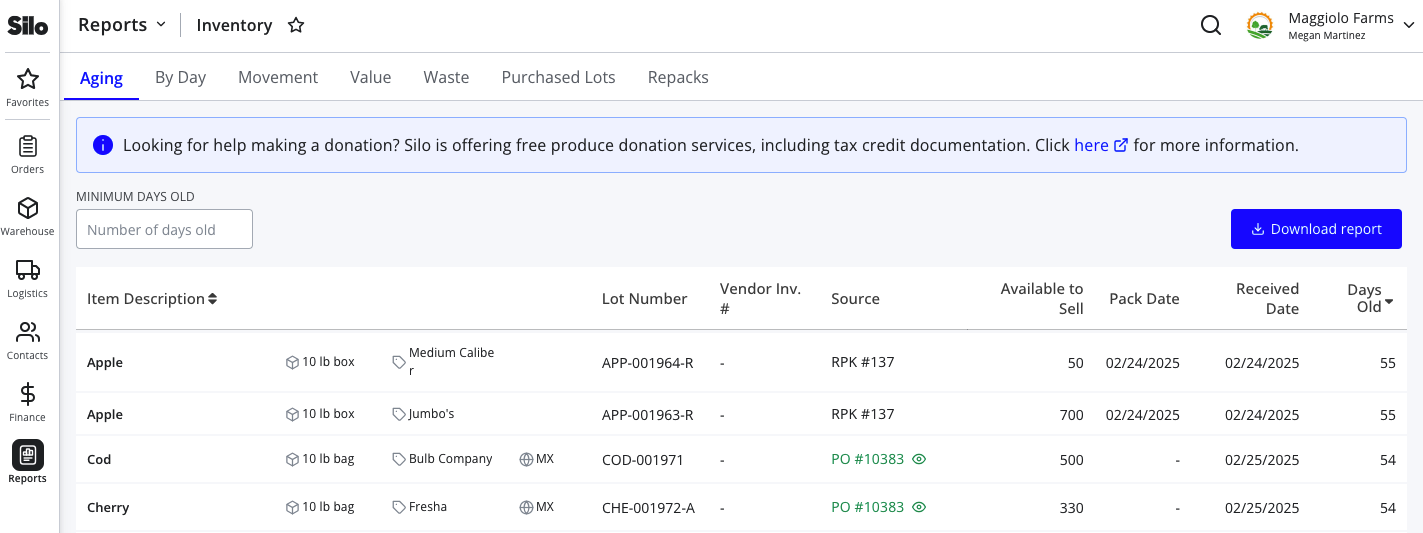
Inventory Aging
Overview
- Shows a list of all of the account's open lots, sorted by number of days old in descending order
- Held lots are called out with a lock icon
- Gives users a way to see aging lots that sales reps should prioritize selling before they go bad
- Can be filtered to show only lots that are at least a minimum number of days old
- Includes a Download report button to export the results to a .csv file
Relevant Settings & Permissions
Access to this report is controlled by the Report features > Inventory Reports > Inventory Aging permission.
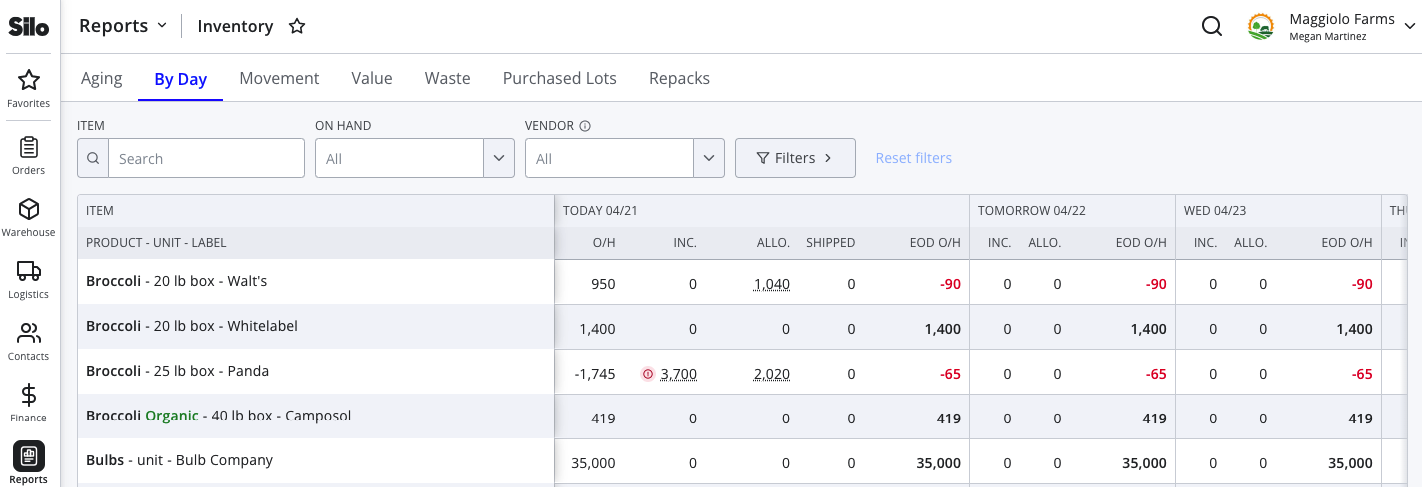
Inventory by Day
Overview
- Help users visualize upcoming sales and transfers to see how much product will be on hand in the next week in order to driving purchasing decisions and repacking workflows
- Similar to the Inventory Movement report, but focuses on upcoming sales rather than retrospective data
- For more information, see the following article: Inventory by Day Report
Calculations
- Today’s EOD O/H = O/H + Inc. - Allo.
- Future date’s EOD O/H = Previous date’s EOD O/H + Inc. - Allo.
Relevant Settings & Permissions
Access to this report is controlled by the Report features > Inventory Reports > Inventory by Day permission.
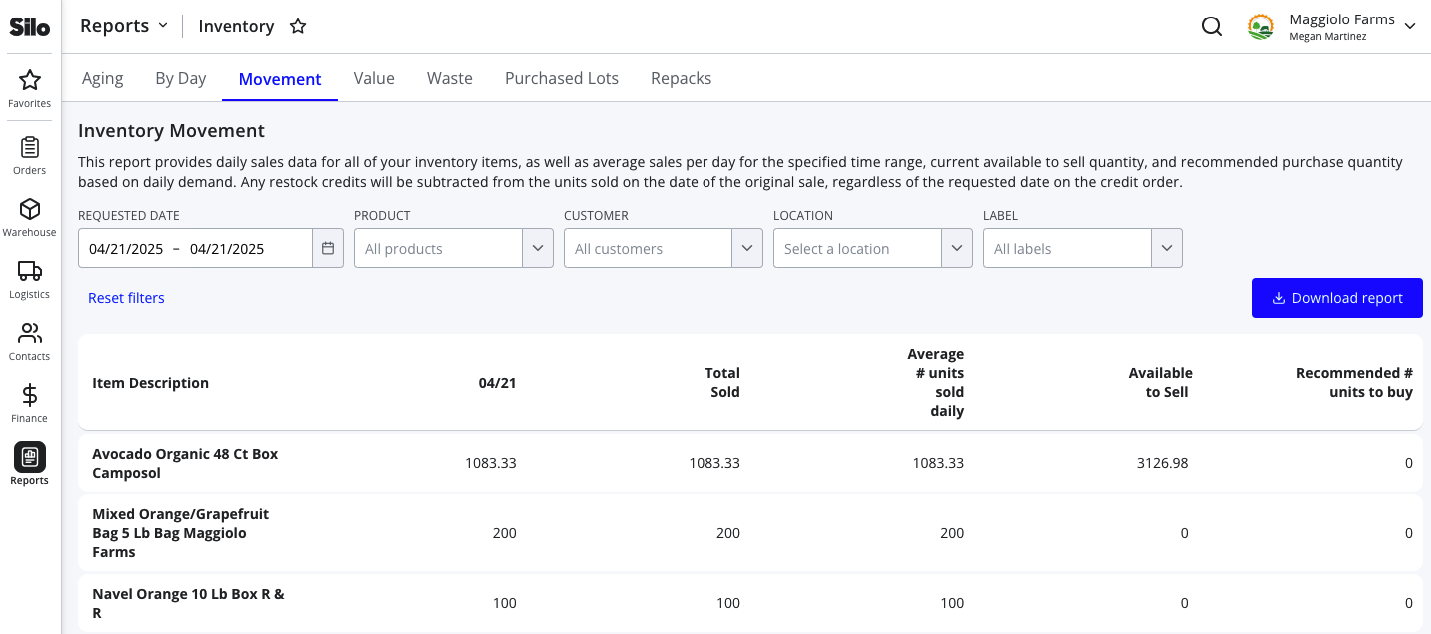
Inventory Movement
Overview
- Helpful tool for users looking to leverage insight from their sales flows & available to sell counts into smart purchasing decisions
- Shows a separate row for each inventory item sold in the specified date range
- Cascaded sales are shown with the parent inventory item
- Each row shows the item name (product, unit, label), number of units sold on each day of date range, total sold, average number of units sold per day, current available to sell quantity, and recommended number of units to purchase
- Allows filtering the list by product or product category
- Includes a Download report button to export the results to a .csv file
Calculations
Recommended units to buy = Total Sold - O/H Now
Relevant Settings & Permissions
Access to this report is controlled by the Report features > Inventory Reports > Inventory Movement permission.
Inventory Value
Overview
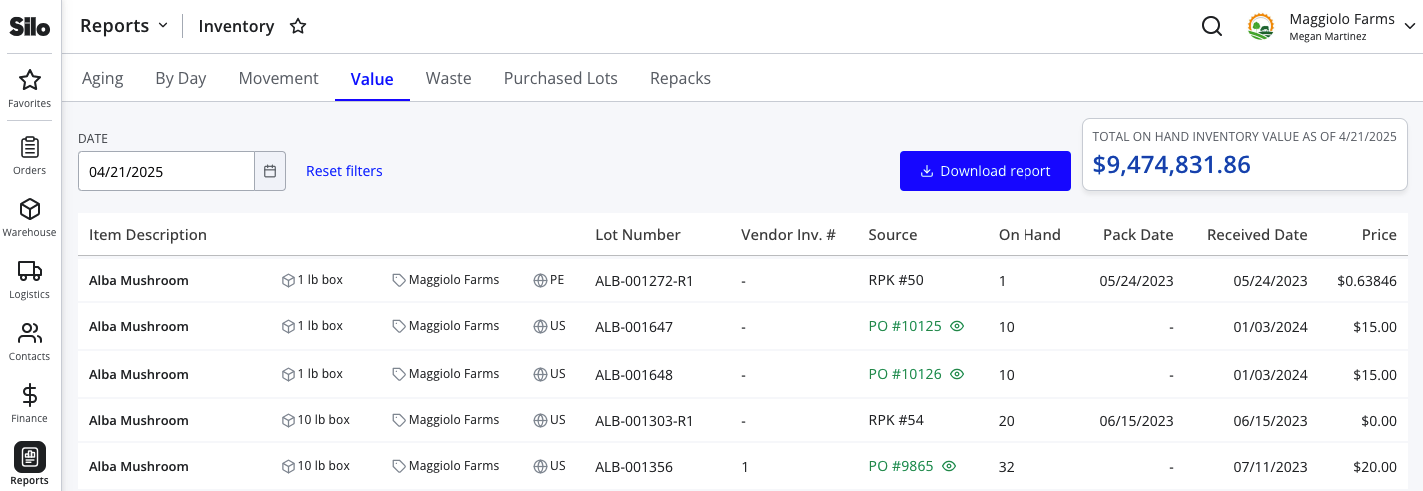
- Shows a list of all of the account's open lots, in ascending order by price (with a secondary sort on product name)
- The Price column also includes a warning icon for lots that are PAS to warn users that the overall value might not be accurate until all lots are priced
- Gives users a way to see the value of all their on-hand inventory as of the specified date, which is especially useful for end-of-year tax purposes
- The full list of a user’s lots and their values can also be exported to a .csv file using the Download report button
Calculations
Total On-Hand Inventory Value = sum of On Hand * Price for each lot listed
Relevant Settings & Permissions
Access to this report is controlled by the Report features > Inventory Reports > Inventory Value permission.
FAQs
Why doesn’t the value on the Inventory Value report match the balance of my Inventory Asset account?
- The start date for the Inventory Asset account may not match when you started using Silo. If you did not fully account for this by entering the correct starting balance for this account, there may be a persistent difference from the Inventory Value report.
- The Inventory Asset account allows manual journal entries that can change the value; these do not affect the Inventory Value report.
- The Inventory Value report is affected by waste, but waste transactions currently do not create automatic journal entries in the Inventory Asset account.
- Journal entries are created in the Inventory Asset account immediately after a purchase order, or sales order is placed. However, on-hand inventory quantities don’t actually change (and thus, the Inventory Value report does not update) until a purchase order is marked as received or a sales order is marked as fulfilled.
Inventory Waste
Overview
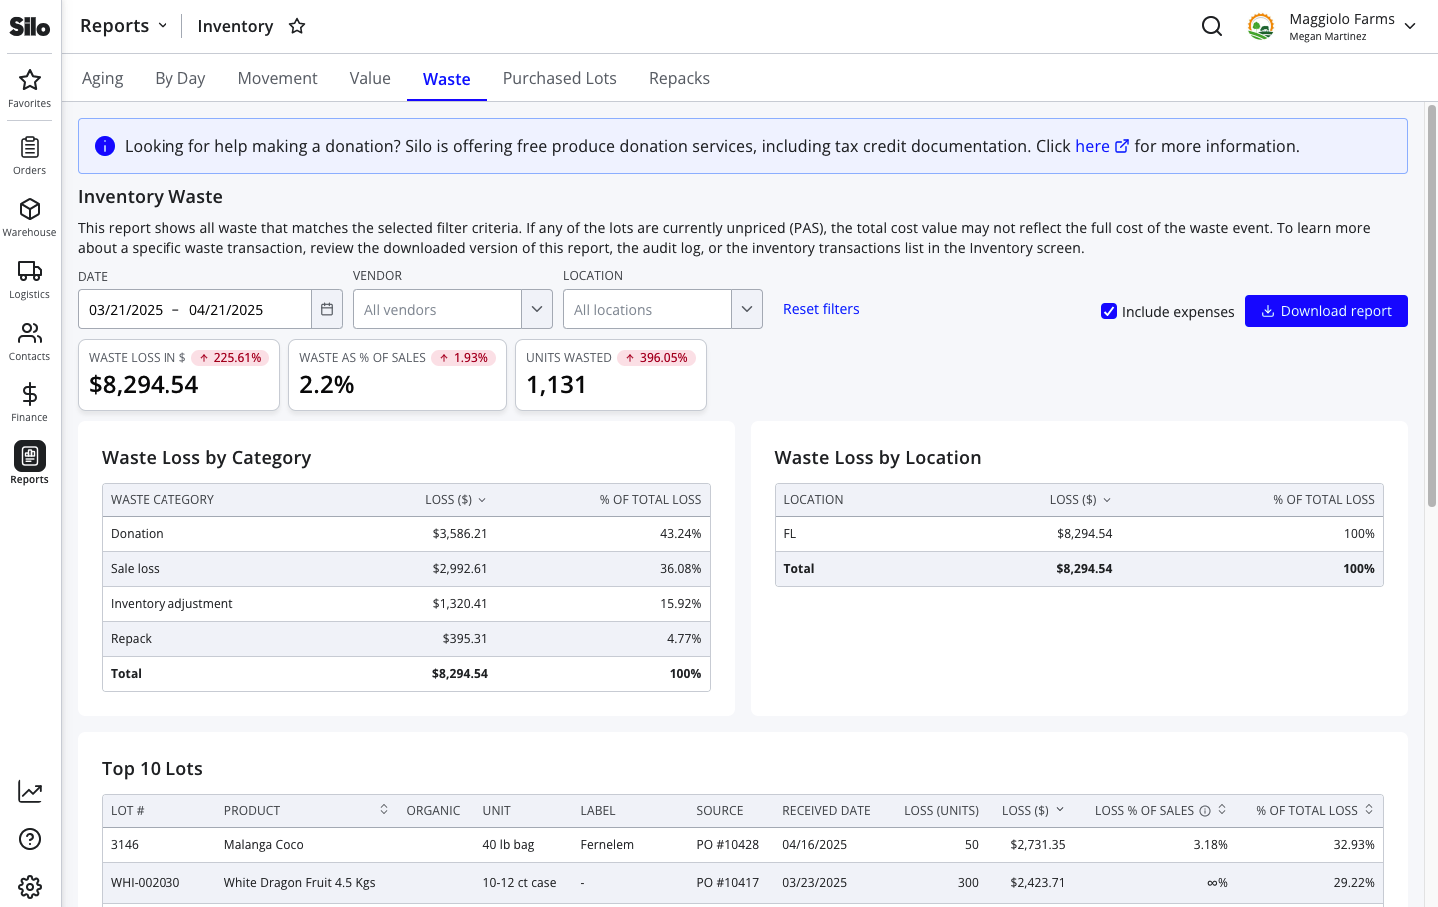
- Shows high-level information about the cost of waste in dollars, waste as a percent of sales revenue, and the number of units wasted in a given time period (with comparisons to the previous period)
- For more information, see the following article: Inventory Waste Report
Calculations
- Revenue = sum of all SO totals (including credits) for the specified time range
- Waste Loss = sum of the cost of all wasted units for the specified time range
- Waste Loss % of Sales = Waste Loss / Revenue * 100
Relevant Settings & Permissions
Access to this report is controlled by the Report features > Inventory Reports > Inventory Waste permission.
Purchased Lots
Overview
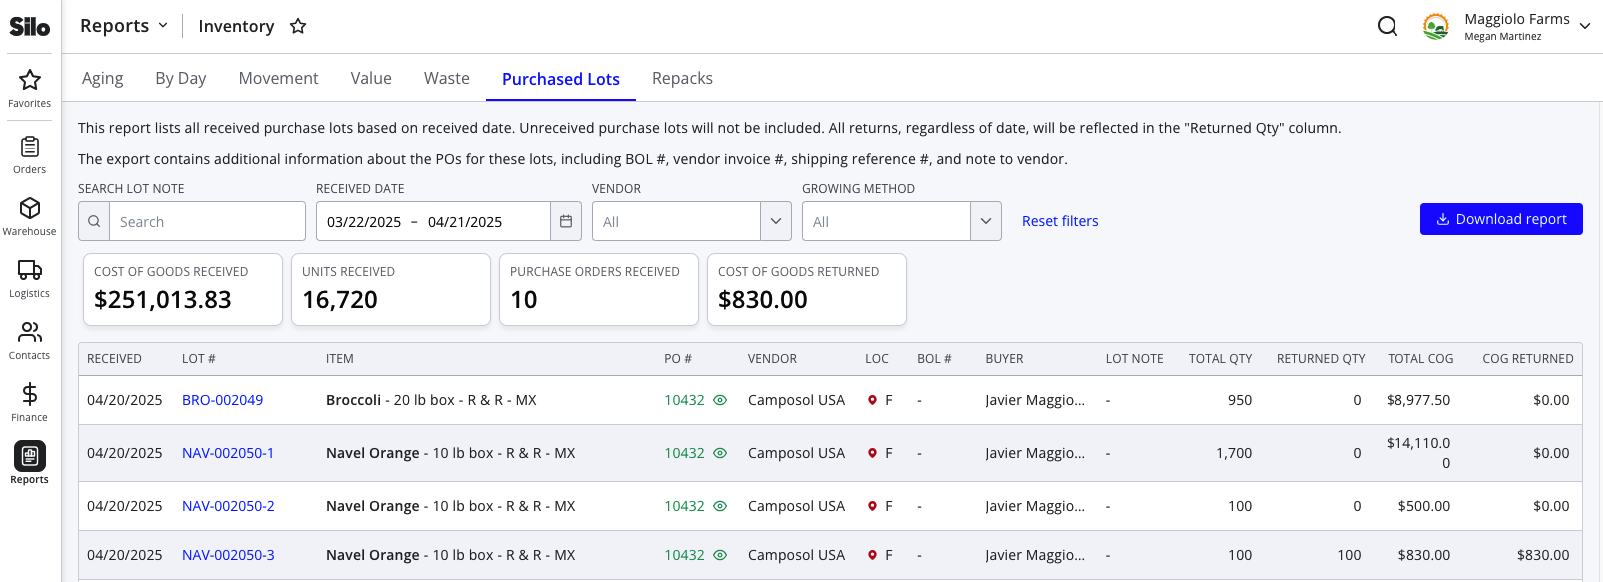
- Shows information about all purchase lots that have been received in the specified time range
- Transfer, repack, and manual lots are not included
- Can be filtered on lot received date, vendor, and growing method (organic, conventional, or both), or searched by lot note text
- Designed to help with auditing, especially organic certification audits that require providing information about all incoming and outgoing organic product
Calculations
Cost of Goods Received = sum of Total COG column for all lots shown
Units Received = sum of Total Qty column for all lots shown
Purchased Orders Received = number of unique POs in the PO # column
Cost of Goods Returned = sum of COG Returned column for all lots shown
Relevant Settings & Permissions
Access to this report is controlled by the Report features > Inventory Reports > Purchased Lots permission.
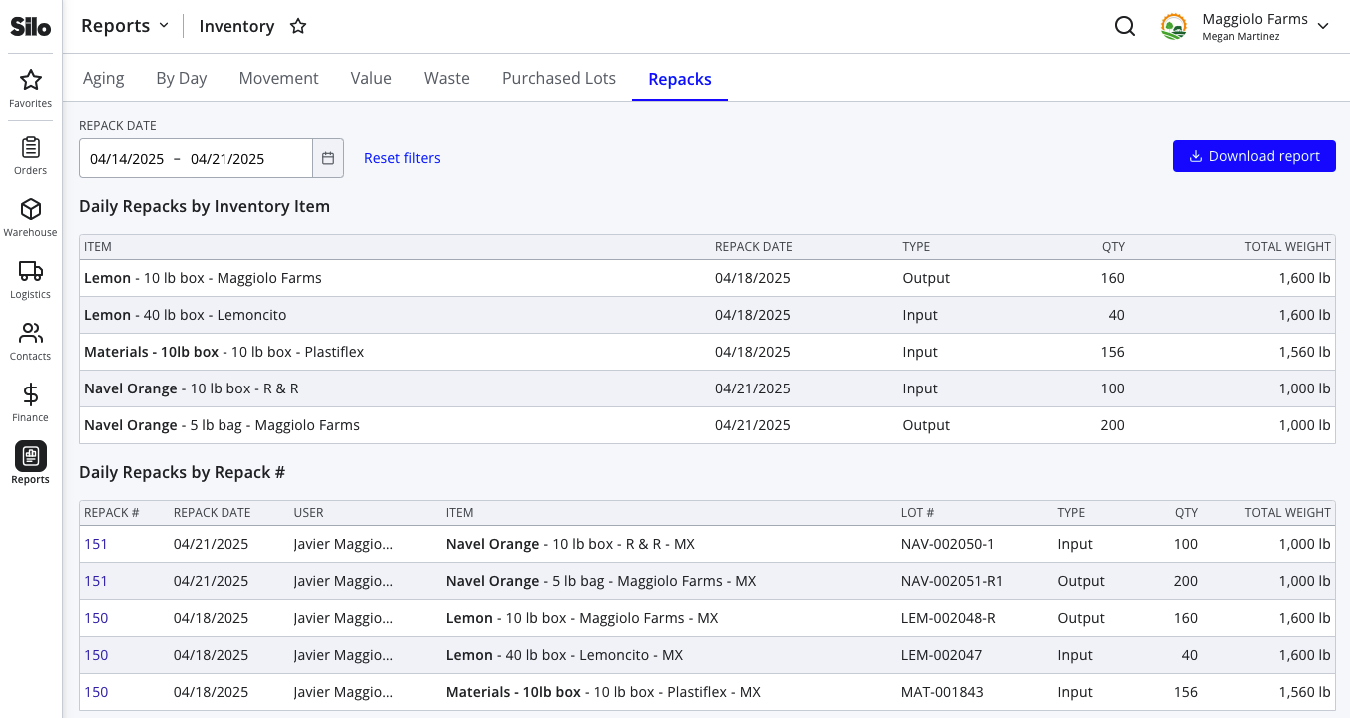
Repacks
Overview
- Shows information about repacks created each day and the quantity and weight of their input and output items
- Includes one table grouped by inventory item and one grouped by repack number
Calculations
Note that all weight and quantity values are rounded to the nearest whole number.
Relevant Settings & Permissions
Access to this report is controlled by the Report features > Inventory Reports > Repacks permission.